Ask any losing trader what went wrong last month and "I overtraded" is one of the most common answers. Ask them how many trades were too many, or what those extra trades actually cost, and the answer is almost always a shrug.
That gap — knowing overtrading is a problem but not being able to measure it — is exactly why it persists. This post is about closing that gap using the one dataset you already own: your own trade history.
What overtrading actually is
Overtrading isn't just "taking a lot of trades." A scalper taking 30 clean, planned trades a day isn't overtrading. A swing trader taking 4 unplanned trades after a losing morning is.
Overtrading is taking trades that weren't part of your plan — usually driven by boredom, the urge to "make it back", or the fear of missing a move. The tell-tale signs:
- Your trade count spikes on your worst days, not your best
- Most of a day's damage comes from the 3rd, 4th, 5th trade onward
- You can't explain the setup for half of yesterday's trades
- You trade more when you're already down for the day
If two or three of those sound familiar, this is worth measuring properly.
Why it happens (the psychology)
The behavioural finance literature is consistent on this: humans are wired to act after a loss, not to sit still. A losing trade creates a small stress response, and taking another trade feels like regaining control — even when the data says the opposite.
SEBI's FY24 study on individual F&O traders found that over 90% of retail participants lost money, with behavioural patterns — trading too frequently, sizing up after losses, and re-entering impulsively — accounting for a large share of the gap between what traders earn and what the market offers. Transaction costs alone don't explain losses of that scale. Behaviour does.
Overtrading also compounds through cost: every extra trade carries brokerage, STT, exchange charges, GST and stamp duty. For an active F&O trader, the drag from a handful of unnecessary daily trades adds up to a serious number over a year — before you even count the P&L on the bad entries themselves.
The problem with "just trade less"
The standard advice — "be more disciplined", "trade less" — fails because it isn't measurable. You can't improve what you can't quantify. What actually changes behaviour is seeing a rupee figure attached to the habit: "capping at 3 trades a day would have saved me ₹42,000 last quarter." That's a number you don't forget.
That requires replaying your real trades against a rule — which is exactly what a behavioural journal is for.
How to measure what overtrading costs you
Here's the method, which you can run on your own data:
- Group your trades by day. Sort each day's trades in the order you took them.
- Pick a cap — say, the number of trades you plan to take on a normal day (often 2–4).
- Keep the first N trades each day, drop the rest. Sum the P&L of only the kept trades.
- Compare that simulated total to what you actually made.
The difference is the cost of your overtrading — not as a feeling, but as a number.
Doing this by hand across months of trades is tedious, which is why most traders never do it. In TradeDNA, it's one screen.
How TradeDNA helps
1. It shows you when you overtrade. The hour-and-day heatmap makes your pattern obvious — most traders discover a specific "revenge hour" where extra trades cluster and P&L bleeds.
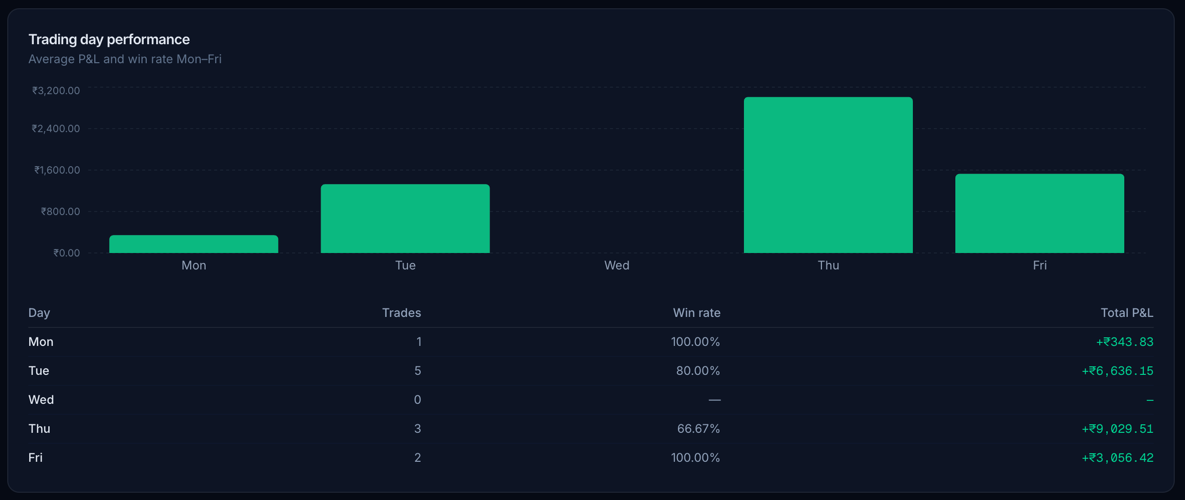
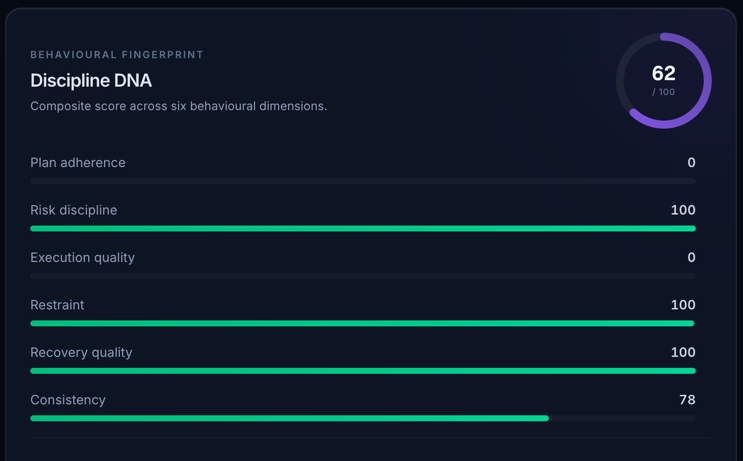
2. Your Discipline Score tracks it over time. Frequency and restraint are two of the six behavioural sub-scores, so you can see whether you're actually improving week over week — not just hoping you are.
3. Discipline Replay puts a number on it. This is the one that changes behaviour. Set a "max trades per day" rule, and TradeDNA replays your actual past trades as if you'd followed it — showing the before/after equity curve and exactly how much you'd have kept.
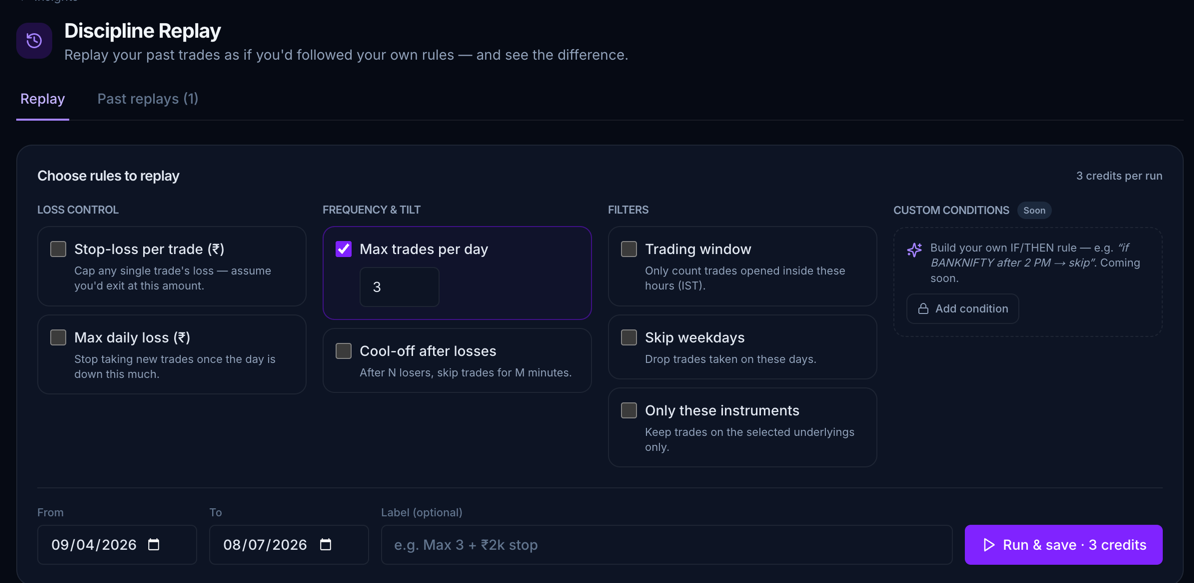
Seeing "following this rule, you'd have kept +₹42,000 more" on your own trades is far more persuasive than any generic advice to "trade less."
A simple way to break the habit
Once you know your number, the fix is behavioural, not technical:
- Set a hard daily trade cap at the level your data shows is optimal — and treat hitting it as a win, not a limit.
- Write a one-line pre-market plan each morning (how many setups, what invalidates them). Traders who log a plan take measurably fewer impulse trades.
- Add a cool-off rule — after two losers in a row, step away for 30 minutes. Your replay can show you what that alone would have saved.
None of this is a prediction about future markets or a recommendation to buy or sell anything. It's a retrospective look at your own behaviour — which is the only part of trading you fully control.
The bottom line
Overtrading survives because it's invisible. The moment you attach a rupee figure to it — from your own trades — it stops being a vague bad habit and becomes a fixable, measurable leak.
If you want to see your own overtrading number, TradeDNA's Discipline Replay runs it on your imported trade history in a couple of clicks.
Related reading: What the Data on Indian F&O Traders Reveals About Revenge Trading · Understanding Your F&O Discipline Score · How to Journal Trades Properly
TradeDNA is a post-trade behavioural analytics product. It provides retrospective analysis of your own trades and is not investment advice, nor a SEBI-registered research or advisory service. It does not recommend instruments or predict prices.